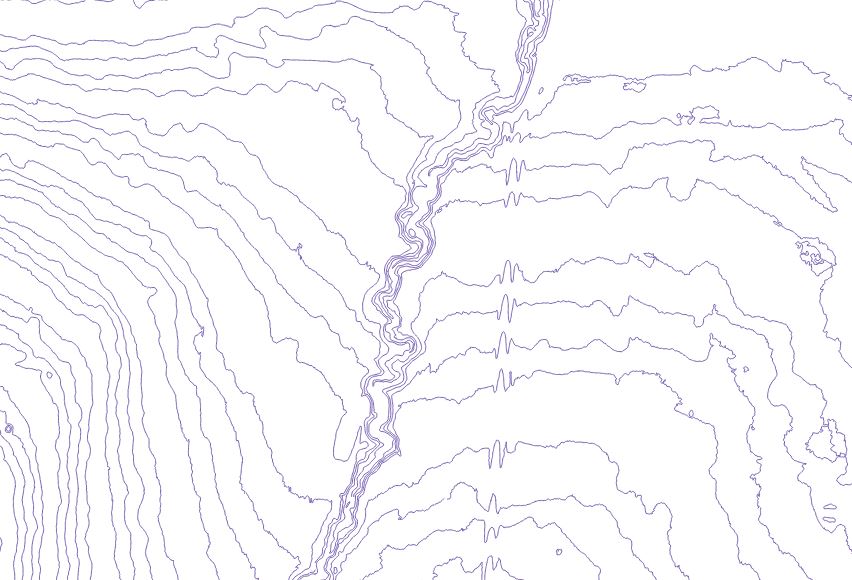
Contours
Contours are a great way to visualize topography on a flat map without covering background imagery. It is often great for figures where you want a visible basemap.
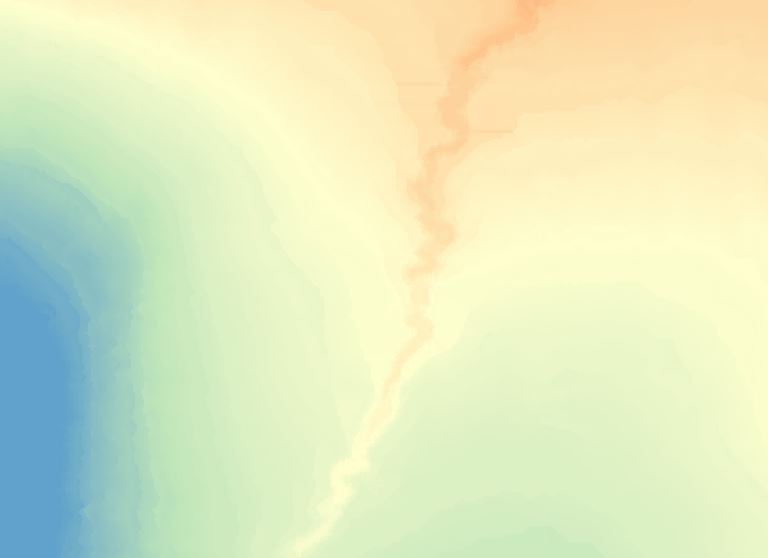
Digital Elevation Model
That being said it is nice to have a digital elevation model (DEM) for easier interpretation of what the ground is looking like. I find this easier to see where there are steep slopes and depressions that may be wetlands.
DEM –> Contours
Generally this is a fairly simple task and most GIS suites can handle it quite simply with a dedicated contour extraction tool. From an elevation raster to vector lines. This is usually simpler as you are decreasing the resolution of the data in a sense and removing all the “in-between” and are just left with the contour break lines.
Contours –> DEM
This is often where I get hung up in processing as its much less intuitive. It makes sense that it would be trickier as you are trying to re-interpret the raw data and fill in all the gaps, where you are starting with break lines shown in the contours. One thing to keep in mind is that I have found that it works much better if your layers are all in the same projection as well as you aren’t using temporary files, such as scratch layers. I find that the permissions in windows often cause issues when GrassGIS is trying to use scratch layers.
- Step 1 - Rasterize the contour lines using Grass GIS v.to.rast.attribute tool. Ensure that you save the raster locally and not just as a temporary file as I have had issues with this previously
- Step 2 - use Grass GIS r.surf.contour to generate a surface from the rasterized contours made in step 1. If your computer is struggling adjust the cellsize. Depending on the scale of your project you may want to increase or decrease this, keeping in mind that smaller values will make larger files and take longer to process.
Things to keep in mind for this process, is that it is an interpolation of the actual surface. This is useful for visualization but should not be considered ground-truthed. As well, you may notice that depending on interpolation settings in r.surf.contour, you end up with a terraced surface in the DSM that coincided with the breaklines of the contours. Though it can be useful for being able to see depressions and slopes in valleys. In QGIS 3+ you can also view the surface in 3d which is awesome.